Every traffic segment in Web Analytics now has its own time-series chart, so you can see how it performed day by day.
Visualize when traffic spikes for certain pages, which channels are declining, which campaigns actually convert, and more.
From the Web Analytics dashboard, select a date range of at least 2 days, then click the “>” button for any audience segment.
Above the already-existing data table, you’ll now see two charts:
- Total traffic by segment. This shows daily Visitors, Pageviews, or Sessions for each segment.
- Share of total traffic by segment. This shows what percent of your overall traffic that each segment got, so you can how proportions change over time.
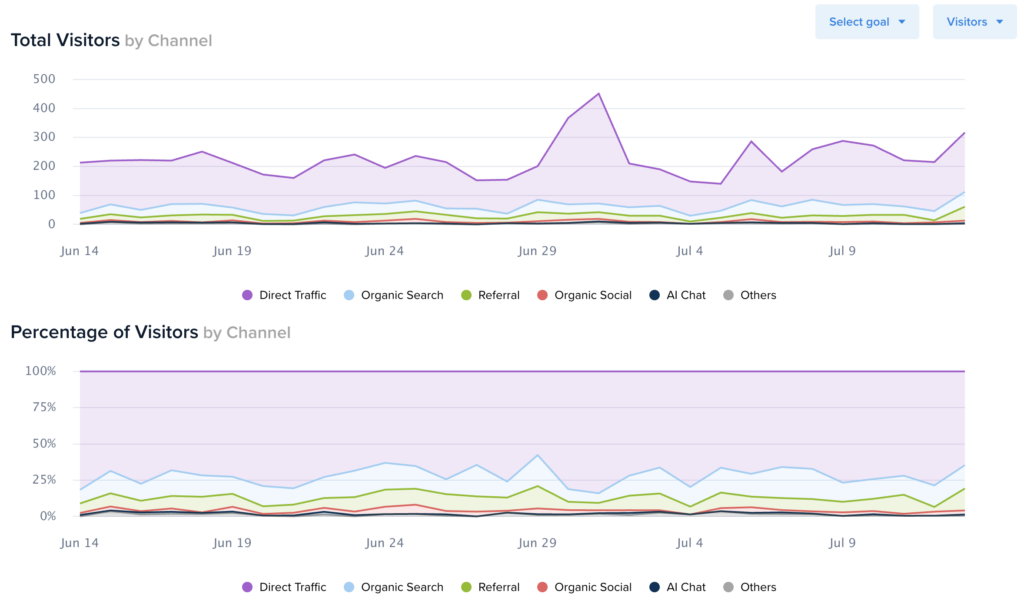
To select whether to see Visitors, Sessions, or Pageviews, pick an option from the dropdown menu in the top-right.
You can also see how conversions trended based on your traffic segments. To do this, select one of your Conversion Goals from the menu in the top-right. The charts will then overlay the number of conversions per day across each chart, using the Y-axis on the right for scale.
And yes, you can export data for all these traffic metrics by day. Download this data by clicking the “Export” button next to the date range selector, then clicking “Export to spreadsheet (.xlsx)”.
Segmented Web Analytics over time is available now for every Crazy Egg plan, at no extra cost. Visit your Web Analytics dashboard and click into any segment to see it.